How Many U.S. Millionaire Households Are There? The Answer Depends on What You Count
About 22% of U.S. households have net worth above $1 million, but far fewer reach that mark without home equity and retirement savings.
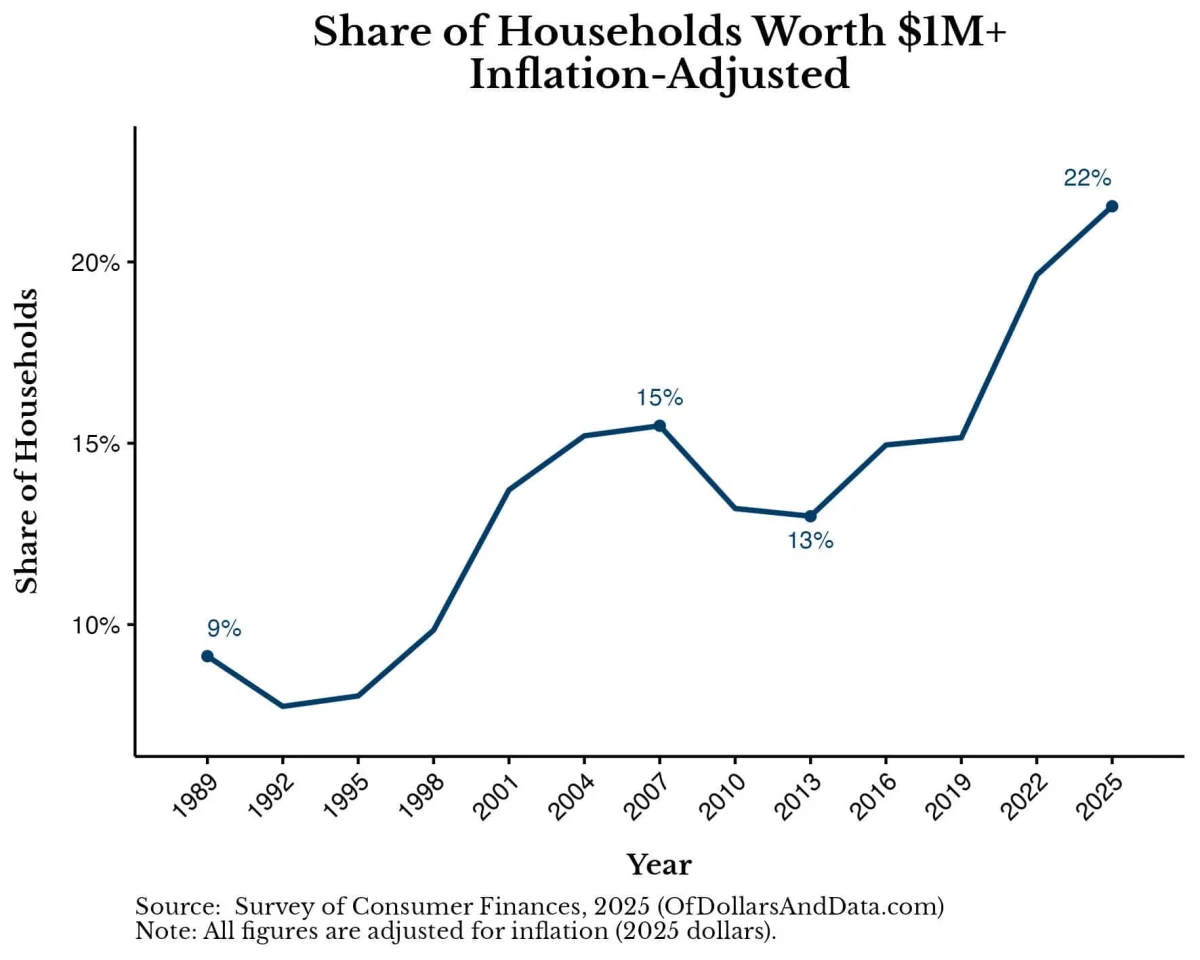
About 29 million U.S. households had net worth above $1 million in 2025, roughly 22% of all households. That share has more than doubled since 1998 after adjusting for inflation, according to the 2025 Survey of Consumer Finances. But the headline number needs context: much of this wealth is held in homes and retirement accounts, rather than money a household can readily spend.

That distinction changes the answer to “How many Americans are millionaires?” The traditional measure counts everything a household owns, minus what it owes. It can include a house, retirement savings and other assets that may not be available for day-to-day spending. A household with a $1 million net worth and little cash in the bank may not feel wealthy in the same way as one with a million dollars in accessible financial assets.
Four ways to measure millionaire status
The 2025 data can be read through four definitions, each answering a slightly different question:
- Net worth: The value of all assets minus all debts. This is the classic definition and includes home equity and retirement savings.
- Net worth excluding the home: Subtract the value of a primary residence and its remaining mortgage debt. This shows how a household’s wealth looks without its home.
- Net worth excluding the home and retirement accounts: Remove home equity and retirement savings. The reasoning is that retirement assets are set aside for later spending, rather than everyday use.
- Liquid net worth: Count non-retirement financial assets, then subtract debts other than a mortgage. This excludes home equity, private business ownership and other real estate, while including shorter-term debts such as credit card balances and auto loans.
The last definition treats mortgage debt differently from shorter-term borrowing. The source’s author previously subtracted all debt when calculating liquid net worth, but argues that a long-term mortgage should not be removed again after home equity has already been excluded in the other measures.
By the traditional net worth measure, 21.5% of U.S. households qualified as millionaires in 2025. When illiquid assets are excluded, the share falls to 6.1%. Put another way, only about 28% of households counted as millionaires by the traditional measure also qualify based on liquid net worth. Excluding both home equity and retirement accounts leaves fewer than half of millionaire households above the $1 million threshold.


Each measure is useful for a different comparison. Traditional net worth gives a broad picture of household wealth. Liquid net worth gets closer to what could be used without selling a home, tapping retirement savings or unwinding a business. Neither measure tells the whole story on its own.
Housing can change the picture
All four measures have risen over time, with especially strong increases in the last six years. Yet the measures don’t always move together. Between 2007 and 2010, the share of households classed as millionaires by total net worth fell, while the share with $1 million or more in net worth excluding the home rose.

That gap shows how changes in home values can affect the count. A household can cross the $1 million line because its home is worth more, even if its other assets have not grown in the same way. A change in the housing market can also push households back below the threshold. The millionaire total is therefore partly a measure of asset values at a point in time, not simply a tally of cash saved.
Most millionaires have less than $5 million
The word “millionaire” covers households with very different levels of wealth. There are nearly ten times as many households worth $1 million to $10 million as there are worth more than $10 million. And among households above $1 million, 77% have less than $5 million. The largest group, 44%, falls between $1 million and $2 million.


This distribution is heavily weighted toward households closer to $1 million than to the much higher end of the wealth scale. The number of households worth more than $10 million has also reached a record, but the increase in households above $1 million over the past six years has been more striking.
What households own also shifts with wealth. For those worth $1 million to $2 million, home equity accounts for around 33% of combined wealth. Among households worth at least $10 million, it makes up about 7%. Private businesses show the reverse pattern: they represent around 5% of wealth for the $1 million to $2 million group and around 33% for households above $10 million.

Stocks and businesses account for a larger share of wealth among the richest households, while home equity and retirement accounts are more prominent for households nearer the $1 million mark. These patterns describe what wealthier households own; they don’t show that owning a business or stocks will make someone wealthy. The households that reach the highest wealth levels are a selected group, so their asset mix shouldn’t be treated as a formula for getting there.
Age matters when comparing wealth
Millionaire status is uncommon among younger households. In the 2025 data, 2% of households headed by someone under 35 had net worth of at least $1 million. The share was 13% for households ages 35 to 44. Among households age 55 and older, more than 30% met that threshold.

The median age of U.S. millionaire households is 63, meaning half are older. Comparing your finances with those of a much older household can overlook the extra years available to earn, save and build assets. Age is not the only factor behind wealth, but it matters when deciding whether a comparison is useful.
Millionaire households remain a minority overall. Around 78% of U.S. households are in the $100,000-to-$1 million range or below, described in The Wealth Ladder as Level 3 or below. The share in Level 4, at $1 million or more, has grown in recent years, but it remains the exception.

The global comparison makes the $1 million threshold look even less ordinary. UBS’s 2026 Global Wealth Report says that $1 million in wealth would place an adult in the top 1.5% worldwide; $100,000 would place an adult in the top 17%.

The practical takeaway is to define the comparison before drawing conclusions. A household’s total net worth, its accessible assets and its age can each produce a different picture. In 2025, having $1 million in net worth was still uncommon, particularly for younger households.