Average Net Worth by Age in 2025: Median Figures and Home Equity
U.S. household wealth varies widely by age. See 2025 averages, medians and percentiles, plus how home equity changes the comparison.
Net worth figures can help put your finances in context, but a single national average can give a misleading impression. In the 2025 U.S. Survey of Consumer Finances (SCF), average household net worth was $1,231,997; the median was $216,100. Age and homeownership change the picture substantially, so the most useful comparison depends on which households you’re measuring and what you count as wealth.
The figures below are adjusted for inflation and shown in 2025 dollars, including comparisons with 2022. They’re benchmarks drawn from groups of households, not targets that every person should reach at a particular age. Income, time in the workforce, inheritance, family circumstances and chance all shape a household’s finances.
What net worth measures
Net worth is the value of what a household owns minus what it owes:
Net worth = assets − liabilities
Assets can include a home, car, bank and investment accounts, and rental properties. Liabilities can include a mortgage, student loans and credit card balances. Subtracting debts from assets gives a broad measure of household wealth.
Age matters when comparing that measure. A household with decades of work and saving behind it has had more time to build assets than one whose members have recently entered the workforce. A younger household may have less wealth today but more years to earn, save and make financial choices. Comparing households at different life stages without that context can obscure what the figures show.
Why the median is more representative than the average
The average U.S. household net worth in 2025 was $1,231,997, up $72,550, or 6%, from $1,159,447 in 2022 after adjusting for inflation. That figure can sound far removed from everyday experience because a relatively small number of very wealthy households pull the average upward.
The median offers another view: it’s the midpoint, with half of households above it and half below. The 2025 median was $216,100, less than one-fifth of the average. It rose by about $5,200, or 2%, from the inflation-adjusted 2022 median of $210,887.
Neither figure describes every household. The average reflects the effect of wealth at the top; the median gives a better sense of the middle of the distribution. Looking at both helps show why one national number can’t stand in for the range of household experiences.
Average and median wealth across age groups
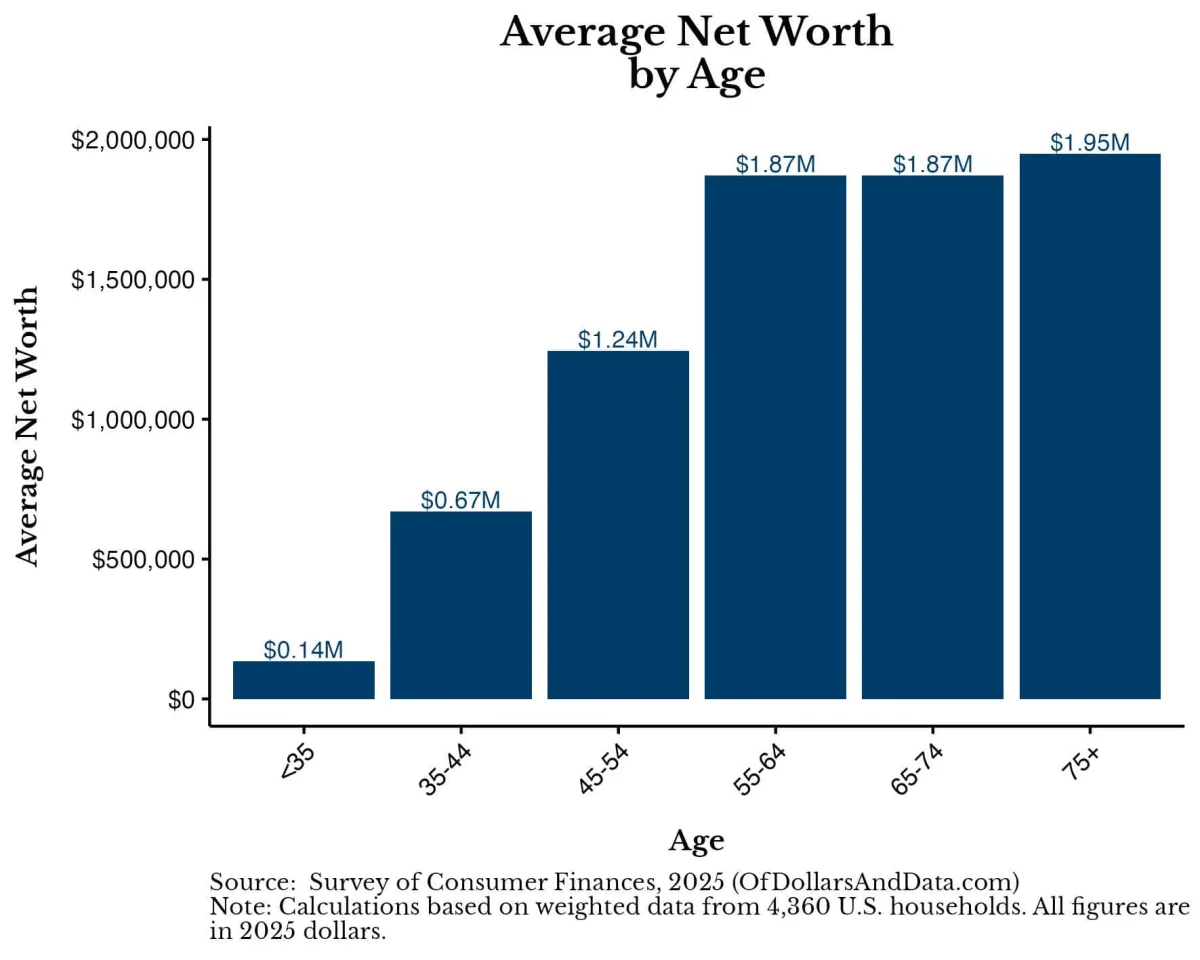
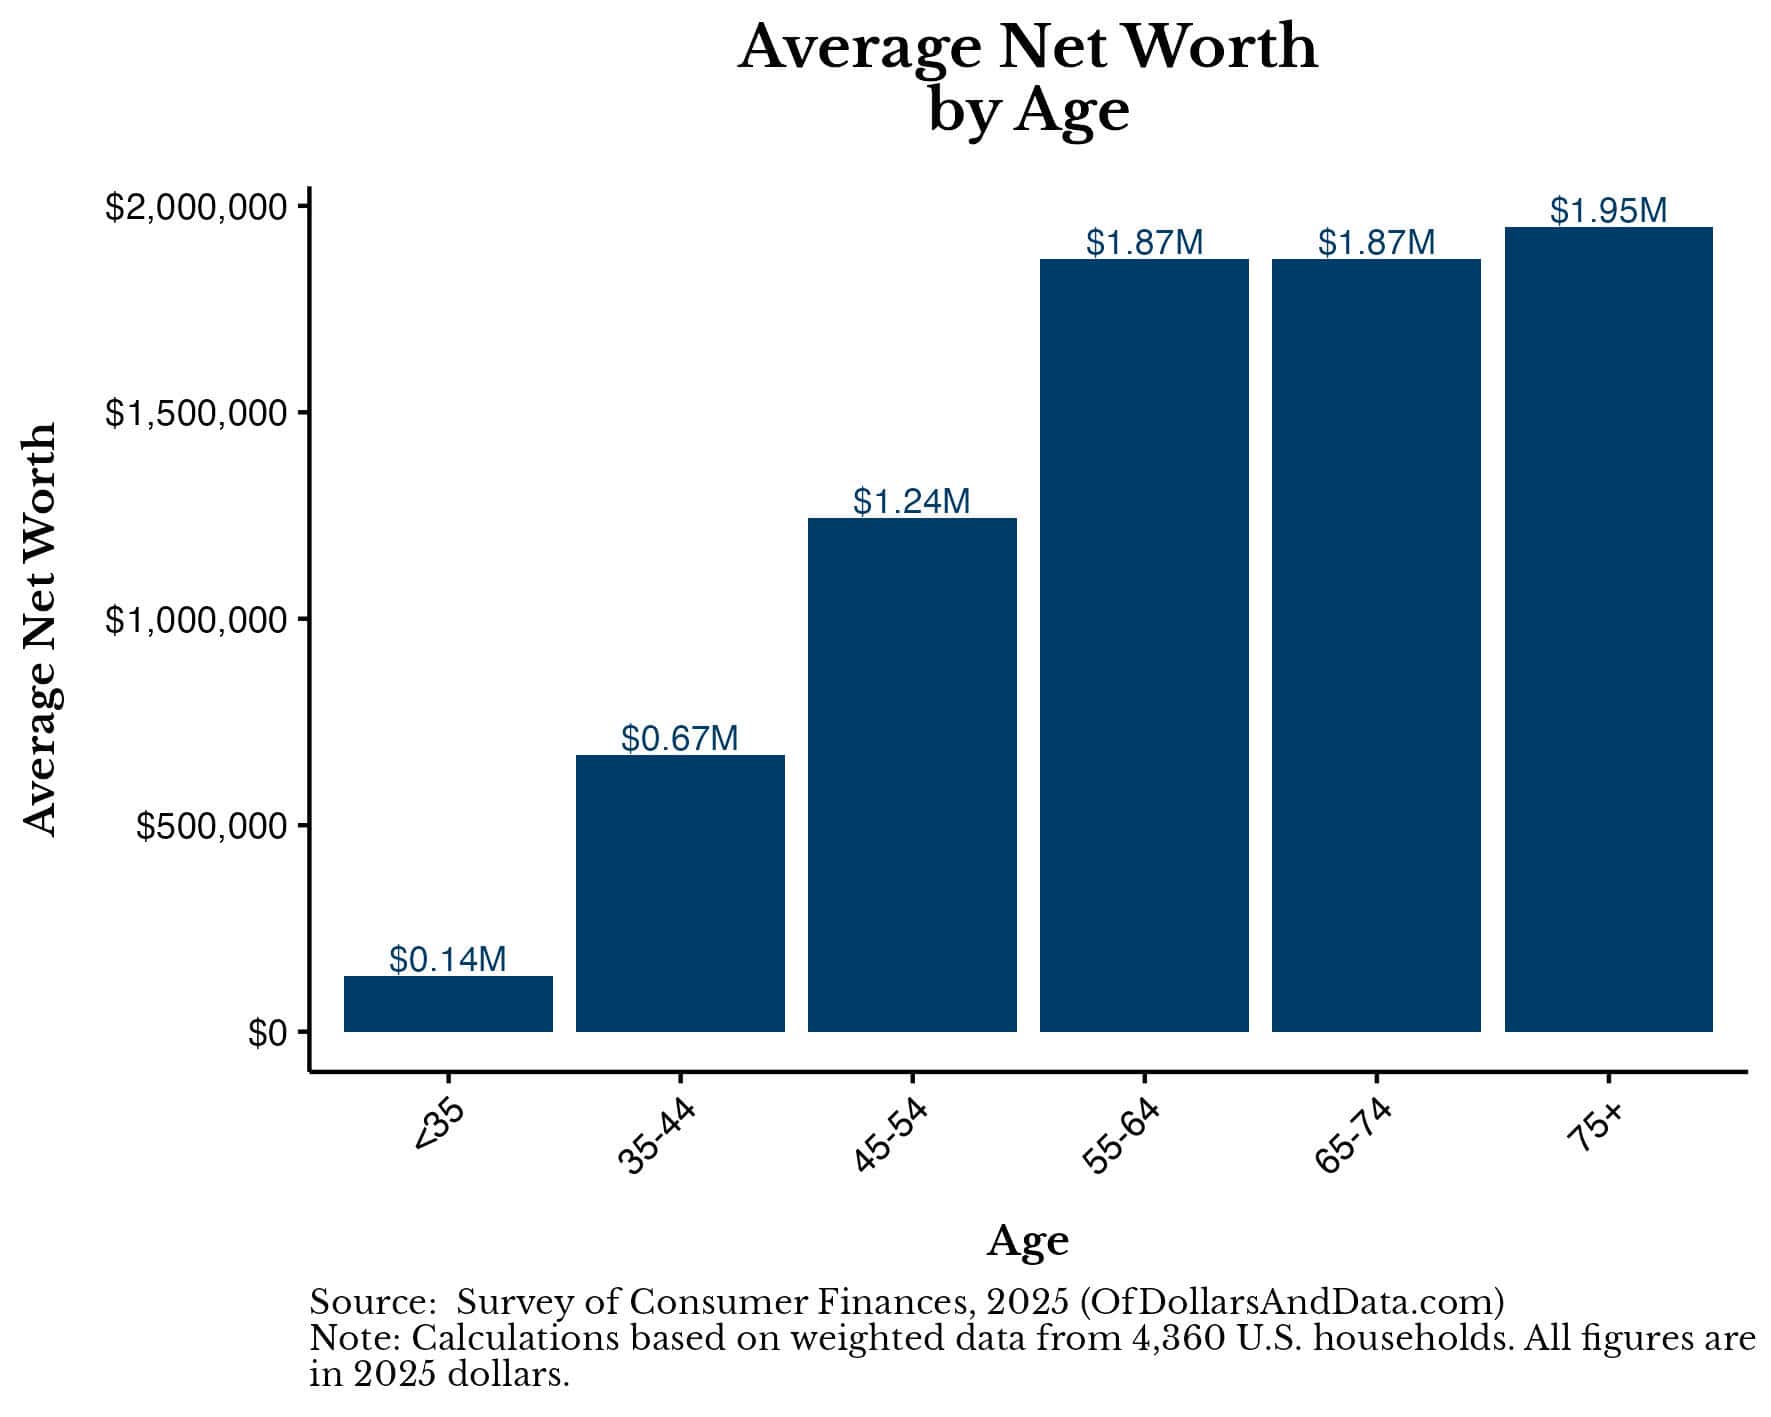
In broad age groupings, the source data puts average household net worth between about $136,000 and $1.95 million. Medians run from roughly $33,000 to $505,000. The table below gives the figures for narrower age bands; all amounts are in 2025 dollars.
| Age range | Average net worth | Median net worth |
|---|---|---|
| Under 25 | $43,566 | $13,050 |
| 25–29 | $104,441 | $35,790 |
| 30–34 | $201,398 | $64,300 |
| 35–39 | $588,215 | $127,170 |
| 40–44 | $757,910 | $181,030 |
| 45–49 | $995,373 | $217,000 |
| 50–54 | $1,499,654 | $290,000 |
| 55–59 | $1,608,679 | $252,020 |
| 60–64 | $2,097,867 | $528,960 |
| 65–69 | $1,818,435 | $436,800 |
| 70–74 | $1,930,205 | $424,400 |
| 75–79 | $1,827,606 | $415,600 |
| 80+ | $2,084,534 | $567,600 |
Both measures generally rise with age, but averages sit well above medians. Wealth appears to climb toward the early 60s and then level off, though the shifts between neighboring age bands shouldn’t be treated as a precise timeline. Each five-year band includes only a few hundred surveyed households, so some jumps and dips may reflect variation in the sample.
The high median for households aged 80 and older also needs context. The source suggests survivorship bias may play a role: wealthier people tend to live longer, so the households still represented at older ages may be wealthier than those who have died. And because the SCF is a snapshot of different households, it can’t show how one group’s wealth changes as its members age. The source points to research suggesting many retirees don’t draw down their savings, but the data here alone can’t establish what happens to the same households over time.
For a closer age match than these broad bands allow, the source provides a net worth by age calculator.
Where different percentiles stand
A median describes the midpoint, but households’ financial paths vary. Pay, inheritances, family needs, luck and other circumstances can all affect wealth. Percentiles make that spread easier to see: the 25th percentile marks a lower point in the distribution, while the 75th and 90th show progressively higher points.
| Age range | 25th percentile | Median | 75th percentile | 90th percentile |
|---|---|---|---|---|
| Under 35 | $3,100 | $32,820 | $145,090 | $351,200 |
| 35–44 | $18,000 | $156,000 | $467,520 | $1,233,620 |
| 45–54 | $54,730 | $254,670 | $941,970 | $2,557,390 |
| 55–64 | $71,790 | $411,340 | $1,416,200 | $3,457,640 |
| 65–74 | $118,105 | $431,900 | $1,312,100 | $3,656,000 |
| 75+ | $144,060 | $504,600 | $1,417,000 | $4,188,260 |
Even the 25th-percentile figures in these age groupings are positive. At the other end, the 90th-percentile amounts are far higher than the medians. Among households aged 45–54, for example, the 80th percentile is about $1.1 million, while the 90th percentile is more than twice that, at about $2.6 million. The climb near the top of the distribution is steep.
The source’s chart comparing the 25th, 50th, 75th and 90th percentiles uses the same vertical scale across its panels, making the size of those differences easier to compare. Another chart breaks out the 10th through 90th percentiles for households under 65; its vertical scales vary between panels to show each age group’s distribution more clearly. Households aged 65 and older aren’t included in that distribution chart. The calculator linked above includes additional age detail.
How home equity changes the comparison
A household’s primary home is often its largest asset. Home equity means the home’s value minus debt secured against it; other real estate remains part of net worth. When home equity is excluded, the national median drops from $216,100 to $69,200.
That difference shows why the definition matters. Total net worth includes home equity, while a measure that excludes it focuses on wealth outside the primary residence. Each can answer a different question, but the figures aren’t interchangeable.
There’s a further wrinkle when comparing medians. The household at the median for total net worth may not be the same household at the median once home equity is removed. For example, the source says a 40-year-old renter with $150,000 in savings would be near the median for total net worth, but around the 68th percentile when home equity is excluded. The bars in a chart comparing the two measures rank households separately; their gap doesn’t show how much home equity a typical household has.
To estimate home equity’s share directly, the source ranks households by total net worth and then calculates the median share held in home equity for two groups: the 40th–60th percentiles and the top 20%, separated by age. For typical households aged 35 and older, home equity accounts for 55% to 70% of net worth. For households in the top 20% of their age group, the share is about 15% to 25%. The typical household under 35 has a 0% home equity share, reflecting that most young households don’t own homes.
Home equity counts as wealth, but it’s less accessible than money in a bank or investment account. Owners may be able to sell, borrow against it or pass it on, and owning a home can mean not paying rent. Yet spending that equity usually requires selling or taking on debt. It can make sense to include it when measuring total wealth and also track a separate figure for money available to spend.
Use the figures as context
Age-based net worth statistics can help you understand broad patterns, but they don’t measure whether your household is doing well by its own needs. The median is often a more relatable starting point than the average, and percentiles show how wide the range can be. Before comparing your own figure, check whether the benchmark includes home equity and whether the age bands match your situation.
These data describe groups, not an individual household’s future. Treat them as context for reviewing your own goals and choices, then focus on the financial priorities that matter to your household.


 2025 Survey of Consumer FinancesRetiree spending and savingsHome equity as wealthNewsletterRelated code